
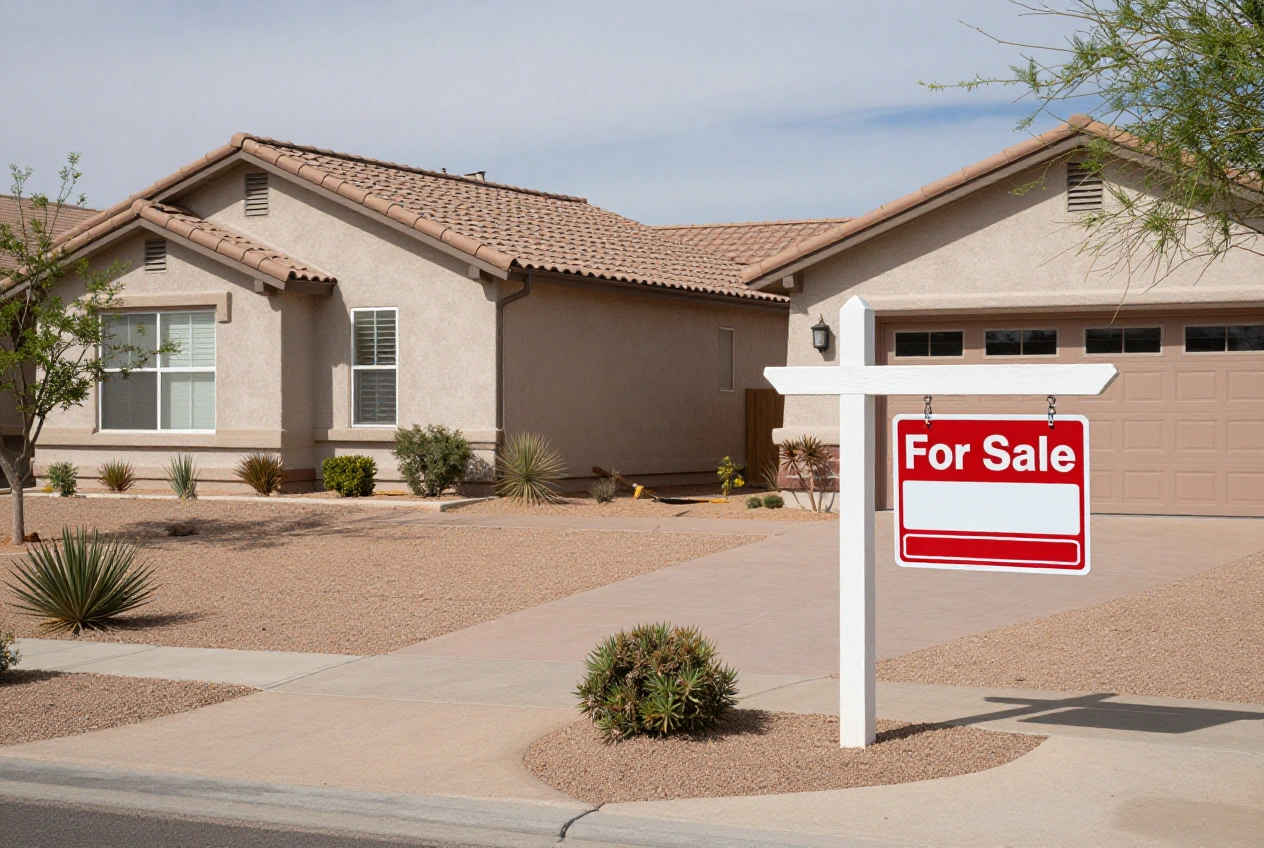
Phoenix Housing Market Cools as Pending Sales Fall 40.1% in September
Greater Phoenix’s single-family housing market slowed in September 2026, with pending sales falling sharply and closed transactions declining from a year earlier. Data from Phoenix REALTORS® showed pending sales down 40.1% year over year, while closed sales fell 4.9% and new listings declined 3.7%.
The slowdown comes as mortgage rates rise above 7%, creating additional affordability challenges for buyers. Although some parts of the region continue to show stronger sales and pricing, the latest figures point to a market where buyers and sellers may need to adjust their expectations.
Why This Matters to Texas Residents
Texas residents considering a move to Arizona for work, retirement or lifestyle reasons can use these figures as a starting point when comparing housing markets. Buyers relocating from cities such as Dallas, Houston, Austin or San Antonio should evaluate the specific neighborhoods and property types they are considering rather than assume that trends in Phoenix will apply across Texas.
For sellers and investors, the data provides insight into how higher borrowing costs and changing inventory can affect transaction activity. However, the Phoenix market alone does not establish whether conditions are improving or weakening in Texas.
Key Greater Phoenix Market Figures
Phoenix REALTORS® reported the following year-over-year changes for the Greater Phoenix single-family market in September:
- Closed sales: Down 4.9%.
- Pending sales: Down 40.1%.
- New listings: Down 3.7%.
- Median sale price: Down 2.1% to $475,000.
- Year-to-date median sale price: Up 0.4% to approximately $482,000.
- Days on market: Down from 79 to 77 days.
The contrast between the monthly slowdown and the slight year-to-date price increase suggests that the market is changing unevenly. A decline in pending sales may indicate that fewer buyers are committing to purchases, but it does not necessarily mean prices will fall by the same percentage.
Phoenix and Scottsdale Show Different Trends
Market conditions vary across the metro area.
In Phoenix city proper, Realtor.com reported a September median listing price of $475,000, down 4.8% from a year earlier. Active listings rose 7.5% to 18,437 homes, and 29% of listings had price reductions. These figures describe asking prices and listing activity, rather than completed sale prices. <Cite refs={[“turn551641search1”]}/>
Scottsdale showed comparatively stronger activity in the supplied Phoenix REALTORS® data. Closed sales increased 2.2% year over year, while the year-to-date median sale price rose 5.5% to approximately $1.25 million. Year-to-date closed sales were also reported to be up 10.6%.
These differences show why buyers and sellers should review local statistics for their specific market. A city’s luxury segment can behave differently from more moderately priced neighborhoods elsewhere in the metro area.
Buyer Interest and Inventory Trends
Despite the slowdown in completed transactions, some measures suggest that buyers are still researching homes.
Zillow’s second-quarter 2026 analysis found an average of 3.8 engaged home shoppers per listing in Phoenix, an increase of 19.8% from a year earlier. Zillow defines engaged shoppers as users who saved or shared a for-sale listing. This indicates online interest, but it does not necessarily translate into offers or completed purchases. <Cite refs={[“turn551641search6”]}/>
Meanwhile, Realtor.com reported that 20.8% of U.S. listings had price reductions in September, the highest September share since 2018. The proportion was higher in Phoenix, at 29%, and in Tucson, at 22.2%. <Cite refs={[“turn551641search2″,”turn551641search1″,”turn551641search0”]}/>
These figures suggest that some sellers are adjusting asking prices to attract buyers. Still, the amount of negotiating room available depends on the property, its condition, its location and competing listings.
Tucson’s Market Offers Another Point of Comparison
Tucson also experienced softer asking prices, though its inventory growth remained relatively modest.
Realtor.com reported a median listing price of $372,500 in September, down 3.2% year over year. Active listings rose 2.5% to 3,851 homes, and 22.2% of listings had price reductions. The median time on market was 58 days, down from a year earlier. <Cite refs={[“turn551641search0”]}/>
For households comparing Arizona locations, these figures provide context on asking prices and available inventory. They should not be interpreted as a direct comparison of completed sale prices between Tucson and Greater Phoenix.
Mortgage Rates Add to Affordability Challenges
Mortgage rates climbed through September and into October. Freddie Mac reported that the average 30-year fixed mortgage rate rose to 7.03% on September 24, 7.28% on October 1 and 7.40% on October 8, 2026. <Cite refs={[“turn551641search7″,”turn551641search3”]}/>
Higher rates increase monthly borrowing costs and can reduce the price buyers can afford. Some households may delay purchases, seek less expensive homes or negotiate more carefully before making an offer.
Although the rise in rates coincided with lower pending sales, the available figures do not establish mortgage rates as the sole cause. Affordability, property selection, buyer expectations and other market conditions can also influence sales activity.
What Buyers and Sellers Should Watch
For buyers, increased listing availability and more frequent price reductions may create opportunities to compare properties and negotiate. However, higher mortgage rates can offset some of the benefit of a lower purchase price. Buyers should compare loan offers and calculate the full monthly cost before committing.
For sellers, the latest figures reinforce the importance of reviewing recent comparable sales and competing listings. Pricing a property realistically from the beginning may help it attract attention, while sellers who need to achieve a specific price may need to allow more time.
For investors and people relocating from Texas, the most useful next step is to compare current neighborhood-level data, property taxes, insurance costs and financing terms rather than relying on broad regional headlines.
Practical Takeaway
Greater Phoenix entered fall 2026 with fewer pending transactions, a modest decline in closed sales and continued affordability pressure. At the same time, Scottsdale and other individual markets show that conditions are not uniform across the region.
For Texas residents considering Arizona, these trends offer useful context—but they are not a forecast for Texas housing or a guarantee that Phoenix prices will decline further. Local market data and a realistic assessment of financing costs remain essential when deciding whether and when to buy, sell or invest.